Category Archives: Maps

Mapping the Varieties of Eriogonum wrightii

Anyone hiking in the Sierra Nevada eventually encounters Eriogonum wrightii (“Wright’s buckwheat” or, if you must, “Bastard sage”). The common form through most of the high Sierra is variety subscaposum—a short, more or less matted, perennial subshrub, with stems bearing white to pink flowers ascending either from throughout the plant, or often from just around its perimeter. It’s found in the Bodie Hills too, often on moderate to steep scree-like slopes.

Eriogonum wrightii has 11 varieties in all: 5 occur only in Mexico (mostly in Baja California); the rest occur in the United States, but at least 3 of these extend across the southern border (and have certainly done so since long before there ever was a border). Most plants will run through the key without much difficulty, and some varieties are largely separate from the others geographically. Where taxon ranges may overlap, only 2 or 3 varieties will vie for your attention.

Curious to learn more about the other 10 varieties of E. wrightii and their distribution, I mapped all 11 using herbarium and iNaturalist data. The range maps were produced in QGIS, based on specimen location data in the SEINet Portal Network and iNaturalist observations (“Research Grade” only) as of December 11, 2023. NOTE: Some dots on the maps may be based on misidentifications or mismapped coordinates; most individual data points have not been reviewed to eliminate such errors, so taxon ranges indicated by these maps should be considered approximate.

I also wrote a key, adapted from Reveal 2005 and Reveal 2014. This key has been modified from the originals by changing some of the terminology, rearranging some couplets, and adding some characters. I like my keys to include some of the information traditionally provided separately in descriptions, and I like to use text color to visually “layer” different categories of information. This is what you get when a botanist takes up information design and learns to love Adobe InDesign software.

The photos below are all from iNaturalist, except for a few from herbarium specimens of rarely observed taxa. All the photos are licensed for non-commercial use by the copyright holders under Creative Commons licenses CC BY 4.0, CC BY-NC 4.0, or CC BY-NCND 4.0. Thank you to all the photographers for allowing these images to be used!

References


Copyright © Tim Messick 2024. All rights reserved.

How Big are the Bodie Hills?

How big are the Bodie Hills? How many square miles? That depends, but first, here are the numbers I’ve come up with:

  • in Mono, CA . . . . . . . . . . . .259 square miles (62%)
  • in Mineral, NV . . . . . . . . . .146 square miles (35%)
  • in Lyon, NV . . . . . . . . . . . . . 12 square miles (3%)
  • Total area . . . . . . . . . . . . . . . . 417 square miles

Overview of the Bodie Hills

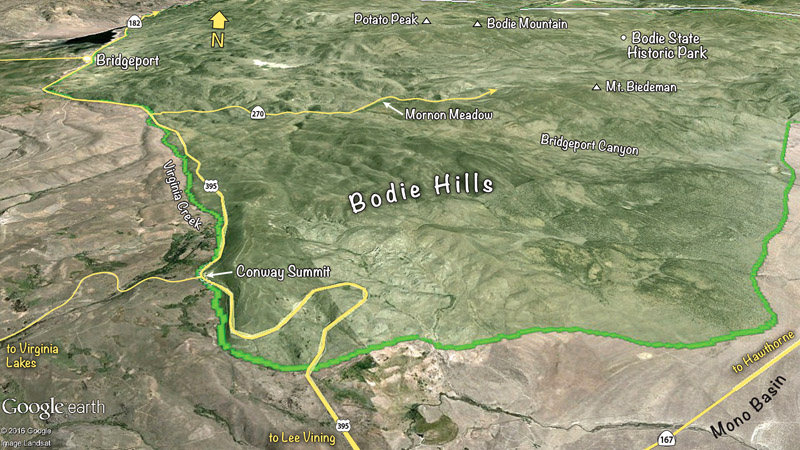
Overview of the Bodie Hills from the southeast

It depends, of course, on where you draw the boundaries. There are relatively sharp natural boundaries in some areas — Virginia Creek along the southwest edge, the East Walker River in the canyon that separates the Bodie Hills from the Sweetwater Mountains, and the edge of Big Meadows south of Bridgeport.

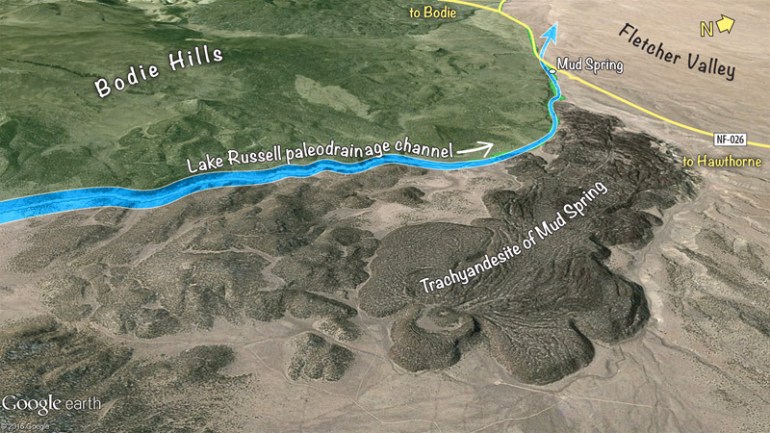
In other areas the natural or physical boundary is less obvious. Along the east side of the range, the channels of Rough Creek and Mud Spring Wash are potential boundaries, but that would include a good bit of Fletcher Valley, with lower elevations and different vegetation than in the Bodie Hills proper. Along the south edge of the range, there is a relatively narrow transition in some areas from the rocky and wooded Bodie Hills to the sandy, mostly shrubby Mono Basin. But there’s no single elevation contour that consistently follows this transition, and the boundary becomes more vague east of Trench Canyon.

Should Cedar Hill (about 12 square miles) be included? I’ve left it outside the Bodie Hills, running the boundary instead through Trench Canyon, but that choice is fairly arbitrary.

Should the very young (<100,000 year-old) late Pleistocene trachyandesite of Mud Spring—the lava dome that fills the narrow far-southeast end of Fletcher Valley—be included? I’ve left it out, following instead the approximate route of the paleodrainage channel of Lake Russell (Pleistocene Mono Lake), along the southern edge of that formation.

Bodie Hills from the east

Bodie Hills from the east

Should boundary follow the East Walker River through the irrigated valley bottom just east of the state line? I’ve drawn it closer to the base of the hill slopes to the south, mostly excluding that valley bottom.

Bodie Hills from the north

Bodie Hills from the north

In some areas lacking a hard “edge” to the Bodie Hills, roads provide a convenient, if somewhat arbitrary boundary. My southern boundary follows roads from US 395 to Cottonwood Canyon. My eastern boundary follows roads in the vicinity of Alkali Lake and in Fletcher Valley from about Mud Spring to the Miocene trachyandesites incised by lower Rough Creek. For convenience, my western boundary follows US 395 south of Bridgeport and State Route 182 north of Bridgeport.

Bodie Hills from the southwest

Bodie Hills from the southwest

One could quibble and fuss over the boundary in a number of places, but further refinement would change the total area (and the number of plants included in the checklist) very little.

Methods: I imported 13 US Topo quadrangles (1:24,000 scale) covering the Bodie Hills into Adobe Illustrator, using Avenza’s MAPublisher plug-in to maintain the georeferencing from the GeoPDFs made by USGS. I drew and adjusted the boundaries described above for the entire range on a new georeferenced layer, copying and joining road and river line segments from other layers where available. I then divided that area using the county boundary lines. I exported the three resulting shapes to a KMZ file, opened that in Google Earth Pro, and looked at the their “measurements” info for the square miles in each county.


Copyright © Tim Messick 2016. All rights reserved.
DOWNLOAD THE CHECKLIST

Mapping Monitor Pass

This is one of those posts about a place somewhat “beyond” the Bodie Hills. But there is a connection: when traveling to the Bodie Hills, I often travel across Monitor Pass, on State Route 89 in Alpine County, east of Markleeville. It’s a wonderfully scenic and botanically interesting area — one of my favorite places along the route to Mono County. Earlier this year I started making a map of the Monitor Pass area (during some spare hours at the office) as a way of getting to know the area better.

Monitor Pass and Vicinity, from Markleeville to Topaz (click to enlarge, back to return):

Monitor Pass and Vicinity

But then the Washington Fire happened. According to InciWeb, the fire incident information system, it was ignited by lightning sometime in early June, but remained small and undetected until June 19, 2015. Between then and the first week of July, nearly 17,800 acres of pine forest and sagebrush scrub burned in the East Fork Carson River watershed between Markleeville and Monitor Pass. Nearly 1200 personnel worked hard to bring the fire under control. They prevented damage to the small city of Markleeville and many nearby recreational sites. Remarkably, they got the  Monitor Pass and Ebbetts Pass roads open and safe to use in time for the annual “Death Ride” on July 11 — a grueling, high-profile, high-altitude cycling event with 5 mountain pass ascents over a course of 129 miles.

So my map of a favorite driving route turned into a fire history map of the Monitor Pass area. I downloaded the final perimeter of the Washington Fire (a KML file available from InciWeb). Then I found a statewide fire history geodatabase from the California Fire and Resource Assessment Program (FRAP) that maps incidents as far back as 1878, though the earliest fire mapped in the Monitor Pass area is 1941.

Fire history map of the Monitor Pass area (click to enlarge, back to return):

Monitor Pass Area Fire History

Fires have very long-lasting effects in this region of steep, arid topography. Pines, junipers, sagebrush and other large woody shrubs take many decades to recover even to a fraction of the cover that was present before a large fire. Areas that burned east of Monitor Pass in 2004 still have little woody vegetation. Areas that burned in the ’70s, ’80s, and ’90s are still clearly visible from the air, in Google Earth, or on the ground. Vegetative biomass and the wildlife habitat it provides takes a very long time to recover.

Washington Fire

Washington Fire burn area, near Heenan Lake, 7/12/2015

Washington Fire

Washington Fire perimeter, near Heenan Lake, 7/12/2015

The maps were compiled in Adobe Illustrator with the Avenza MAPublisher plug-in from GIS data available on the internet. The shaded relief background was created in Adobe Photoshop with the Avenza Geographic Imager plug-in and digital elevation data available from USGS.

MarkleevilleAfter the fire, in Markleeville


Copyright © Tim Messick 2015. All rights reserved.